
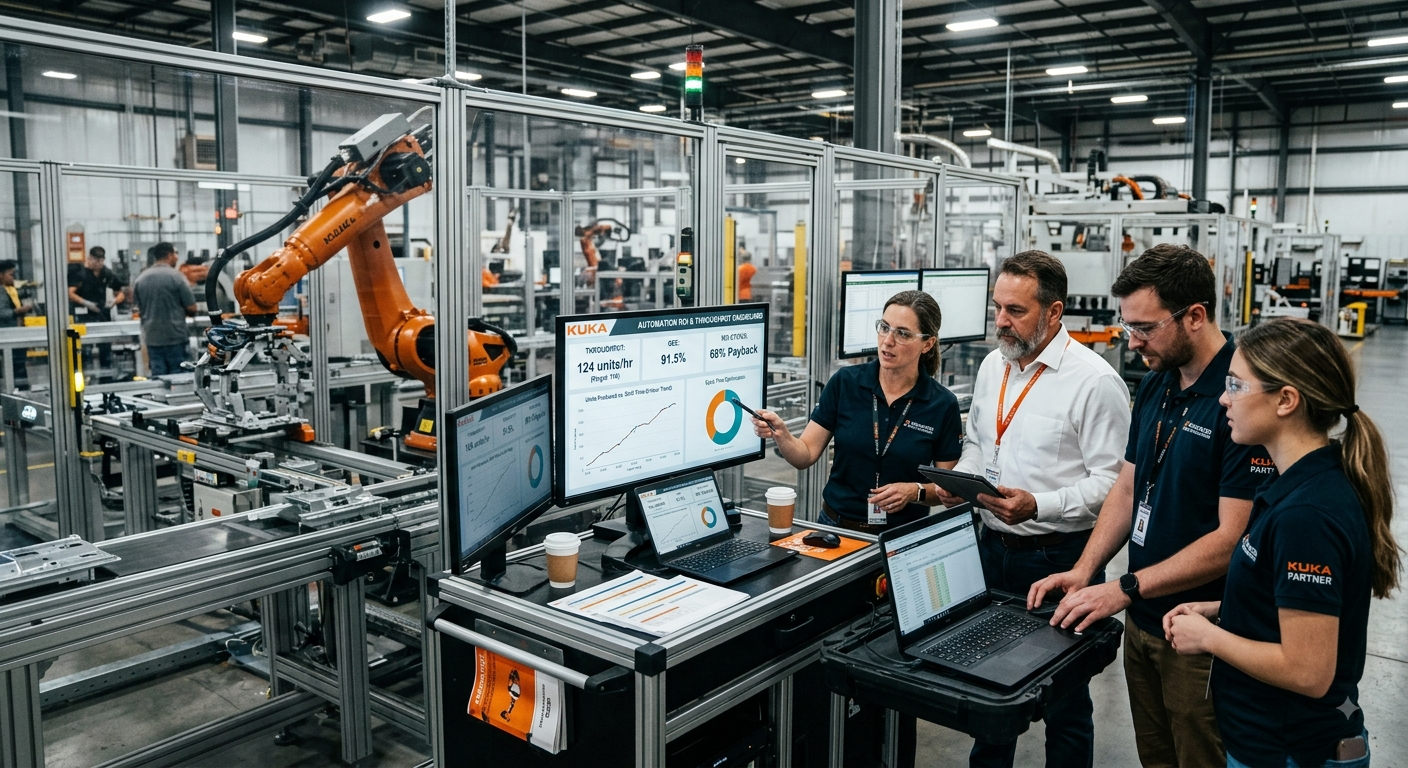
A convincing robotic automation ROI case does not start with the robot. It starts with the production constraint that existed before automation and a measurable result after commissioning. Without that baseline, a percentage improvement may sound impressive but tell a plant manager very little about whether the same investment would work in another factory.
Official KUKA case studies provide several useful examples because KUKA discloses actual production figures in some projects. One machining operation cut clamping time from as much as 15 minutes to two minutes. In another application, automated palletizing increased output from roughly 20–25 tonnes per shift to about 40 tonnes, while an SME automation project reported approximately 40 percent higher productivity.
Those figures provide useful evidence, but they do not create universal ROI benchmarks. Each result reflects a specific process, layout, equipment configuration, and operating environment. Industrial buyers should therefore ask whether their own production losses resemble the conditions that produced those results.
Why Before-and-After Numbers Matter More Than Automation Claims
Statements such as “automation increases productivity” are too broad for an investment decision. Productivity can improve because a robot reduces loading time, extends productive machine hours, shortens changeovers, or removes a manual bottleneck. Each mechanism creates a different financial result.
For example, a ten percent productivity improvement on an expensive machining center that already runs near capacity can create substantial value. A larger theoretical improvement at a workstation with significant unused capacity may create little financial benefit if customer demand does not require additional output.
For this reason, URT recommends defining the KPIs used to measure robotic automation before selecting equipment. Operations teams can establish a meaningful baseline by tracking cycle time, machine utilization, output per shift, scrap, rework, labor requirements, downtime, and changeover losses.
The following KUKA examples work best as production evidence rather than promises. Each case demonstrates a different mechanism through which automation created measurable value.
Case Study 1: Machine Loading Cut a Manual Step from 15 Minutes to Two
One of the clearest before-and-after examples comes from KUKA’s own machining operations. A machining center used to produce components for KR QUANTEC robots required operators to load, align, and clamp heavy workpieces manually with crane assistance.
According to the official KUKA machine-tool automation case study, operators previously needed up to 15 minutes for the manual clamping operation. Robotic handling reduced that task to two minutes.
KUKA also reports that the resulting system operates 70 percent unmanned and supports automated night shifts. According to the case study, the solution increased productivity by ten percent and enables the operation to machine approximately 300 additional components per year compared with the conventional approach.
Where did the productivity improvement come from?
The ten percent figure alone does not explain the result. Automation removed non-productive handling time around an expensive production asset. As a result, the machining center could spend a greater proportion of its available hours machining components instead of waiting for manual handling.
The system also changed the labor model. Automated loading reduced the need for operator involvement during every production cycle and supported unmanned operation. That capability can create economic value even before a plant calculates the contribution of additional output.
This distinction matters when evaluating robotic CNC machine loading and unloading. A robot can attack a genuine utilization constraint when a machine regularly waits for manual loading. Faster loading will create much less value when the machine spends most of its idle time waiting for orders, materials, or upstream operations.
What does the case study not prove?
The result does not mean that machine tending normally increases productivity by ten percent. The improvement depends on the amount of non-productive time before automation, machining cycle duration, material availability, and the practicality of unattended production.
The reported productivity increase also does not establish a universal payback period. A plant still needs to calculate the total cell investment, integration costs, labor effects, maintenance requirements, additional productive capacity, and financial value of the extra output.
Case Study 2: Palletized Output Rose from 20–25 to About 40 Tonnes per Shift
A second KUKA case provides a useful example of throughput measured in physical production rather than percentages alone. At Certech, workers previously handled the palletizing operation manually.
According to KUKA’s Certech palletizing case study, workers handled approximately 20 to 25 tonnes per shift before the automation project. The robotic system handles about 40 tonnes over the same period.
That comparison gives an operations team a concrete production measure. Instead of relying on a general claim about robot speed, the case connects automation directly to output per shift.
The robot alone did not create the result.
Plant managers should not attribute the 40-tonne result exclusively to the robot arm. Palletizing throughput also depends on product arrival, gripper design, pallet patterns, product stability, pallet availability, conveyor timing, cell programming, and downstream pallet removal.
The more useful comparison therefore looks at complete processes: manual palletizing before the project and the integrated robotic system after commissioning. The same principle applies when comparing industrial robots with traditional palletizing systems.
A plant considering palletizing automation should first identify its current constraint. When workers cannot consistently clear the end of the line, automation may protect upstream throughput. However, higher theoretical robot capacity may have little effect on actual plant output when the existing palletizing operation already has substantial spare capacity.
Throughput still has to create financial value.
Higher output is not identical to ROI. Additional tonnes per shift create financial value only when the plant can sell or otherwise use that extra capacity.
A proper business case should also account for labor deployment, cell availability, maintenance, tooling, guarding, integration and changes to conveyors or pallet handling. The before-and-after throughput figure proves that the process changed, but the plant must perform its own financial analysis to determine the return on capital.
Case Study 3: An SME Robot Cell Reported About 40 Percent Higher Productivity
Some manufacturers assume that strong automation economics require large-volume production. A KUKA case involving Rohmann Automation provides a useful counterexample, although buyers still need to interpret the reported result within the conditions of that specific process.
The project centered on repetitive sheet-metal processing. A robot picks up a blank, loads it into a servo press, and removes the processed component. The cell design also allows loading and unloading without interrupting the production sequence.
In KUKA’s SME robotics and automation case study, Rohmann Automation reports an approximately 40 percent productivity increase. The case also states that automation relieved two to three employees from repetitive bending work so the company could deploy them elsewhere.
Why does labor redeployment matter?
The financial logic goes beyond replacing manual work with a robot. When a company redeploys employees, the value comes from what those people can contribute elsewhere in the production system.
For example, additional labor capacity could relieve another bottleneck, reduce overtime, or support more production. A company should measure those effects instead of automatically treating every redeployed hour as a direct payroll saving.
This distinction becomes particularly important when justifying automation when higher volume is not the only objective. Stable cycles, predictable output, and better allocation of available labor can support an investment case even when additional production volume is not the primary objective.
A KUKA Packaging Example Shows Why Payback Needs Context
Some manufacturer examples go beyond productivity figures and provide a potential payback period. Buyers need to treat these figures with even greater care because plant-specific economics directly determine payback.
In an official KUKA example involving automated sandwich packaging, two KR AGILUS HM robots package between 50 and 60 sandwiches per minute. KUKA states that the company may achieve a return on investment after approximately 16 months, depending on the size and effectiveness of the operation.
That qualification matters. A plant should not transfer the 16-month figure into its own business case as an expected result. Labor rates, shift patterns, production volumes, product mix, cell cost, utilization, maintenance, and the existing packaging method can all change the payback period.
This distinction separates a case-study result from an investment assumption. The case study describes what a specific operation achieved under its own conditions. A new buyer must rebuild the financial case using its own production and cost data.
What These KUKA Cases Actually Say About Robotic Automation ROI
Taken together, the examples show several ways automation can create measurable value. The machining project reduced handling time and increased productive machine use. The palletizing project increased physical output per shift. Rohmann Automation combined higher productivity with labor redeployment, while the packaging example connected automated production with a conditional payback estimate.
None of these examples establishes a standard ROI percentage for industrial robots. Copying a manufacturer’s case-study result directly into an investment proposal would therefore create unnecessary financial risk.
A stronger business case starts by identifying the mechanism that should create value in the proposed cell. When higher throughput drives the project, measure the current bottleneck first. For labor-driven projects, establish which hours will change and determine whether the company will remove, redeploy or use those hours to support additional capacity.
Machine-utilization projects require the same discipline. Operations teams should record how much productive time the current process loses to loading, unloading, and waiting before assigning financial value to robotic handling.
Quality also requires a measurable mechanism. Automation can repeat a controlled process consistently, but it can also repeat an unstable process without solving the underlying problems. Include scrap or rework savings in an ROI calculation only when the proposed cell can realistically address the causes of those losses.
Build the baseline before requesting the robot.
Collect baseline data while the existing process still operates. Waiting until after commissioning makes it harder to determine whether an apparent improvement came from the robot, different staffing, a change in production volume, or another process modification.
A good baseline also shows the integrator where automation must create measurable value. Selecting a robot before completing this analysis can leave the plant with technically capable equipment that does not solve an economically important constraint.
When Strong Case-Study Numbers Should Not Persuade You to Automate
A process can resemble a successful case study and still make a poor automation candidate. High manual labor content alone does not establish process readiness.
If parts arrive unpredictably, fixtures locate components inconsistently, upstream production frequently stops, or operators routinely compensate for process variation, robot selection will not solve the underlying production problem. The plant should stabilize those variables or design the automation specifically to manage them before committing capital.
Unused capacity creates another risk. A project may increase theoretical throughput without generating enough additional saleable output to justify the investment.
Maintenance capability also affects the business case. Plants need a realistic plan for fault diagnosis, spare parts, and technical support before the robotic cell becomes a production dependency.
Use the following checks to challenge the business case rather than simply confirm a decision that the project team has already made.
- Measure current output per hour or shift under normal production conditions.
- Record manual handling, loading, unloading, and changeover time separately from productive process time.
- Identify whether the proposed robotic operation represents the actual production bottleneck.
- Measure scrap and rework before assigning quality savings to the project.
- Define how operator hours will change and whether the company will remove, redeploy, or use that labor for additional capacity.
- Include tooling, integration, safety equipment, programming, training, and commissioning in the project cost.
- Estimate downtime and maintenance requirements instead of assuming continuous robot availability.
- Confirm that upstream and downstream equipment can support the proposed automated cycle.
- Set a post-commissioning period for measuring the same KPIs again.
FAQ
Can KUKA case-study ROI figures predict my project’s ROI?
No. Manufacturer case studies show what a particular automation approach achieved under specific production conditions. Your plant should calculate ROI from its own cycle times, labor costs, production demand, integration costs, downtime assumptions, and expected utilization.
Does higher throughput automatically mean higher ROI?
No. Higher throughput creates financial value when the business needs and can use the additional capacity. If another operation limits production or customer demand does not require more output, the throughput increase may create much less financial value than the percentage suggests.
What should a plant measure before installing an industrial robot?
Start with the variables connected to the reason for the investment. Useful measures can include output, cycle time, machine utilization, manual intervention, downtime, scrap, rework, changeover losses, and labor hours.
Can a company include labor redeployment in an automation business case?
Yes, but the company should value that labor according to what happens after automation. Moving an operator to another constrained process can create measurable value, but the business should not automatically count that change as a direct payroll saving when headcount remains unchanged.
Why can two similar robotic cells produce different ROIs?
The robot may be similar while the economics differ significantly. Shift patterns, demand, current manual cycle time, tooling, integration complexity, labor costs, process stability, maintenance capability, and utilization can all change the financial result.
Should a plant automate an unstable manual process?
The plant should first identify the source of the instability. A robot can repeat defined actions reliably, but uncontrolled part presentation, inconsistent fixtures, variable inputs, and undocumented operator decisions can make the complete automated process unreliable.
Are manufacturer case studies useful if their results cannot be copied?
Yes. Their strongest value comes from showing the mechanism behind an improvement. A plant can identify whether the same source of lost time, capacity, or labor exists in its operation and then measure that loss directly.
Talk to URT About Robotic Automation ROI
If you are evaluating robotic automation ROI, contact URT. We will give you a direct, technical answer based on your actual production requirements.