
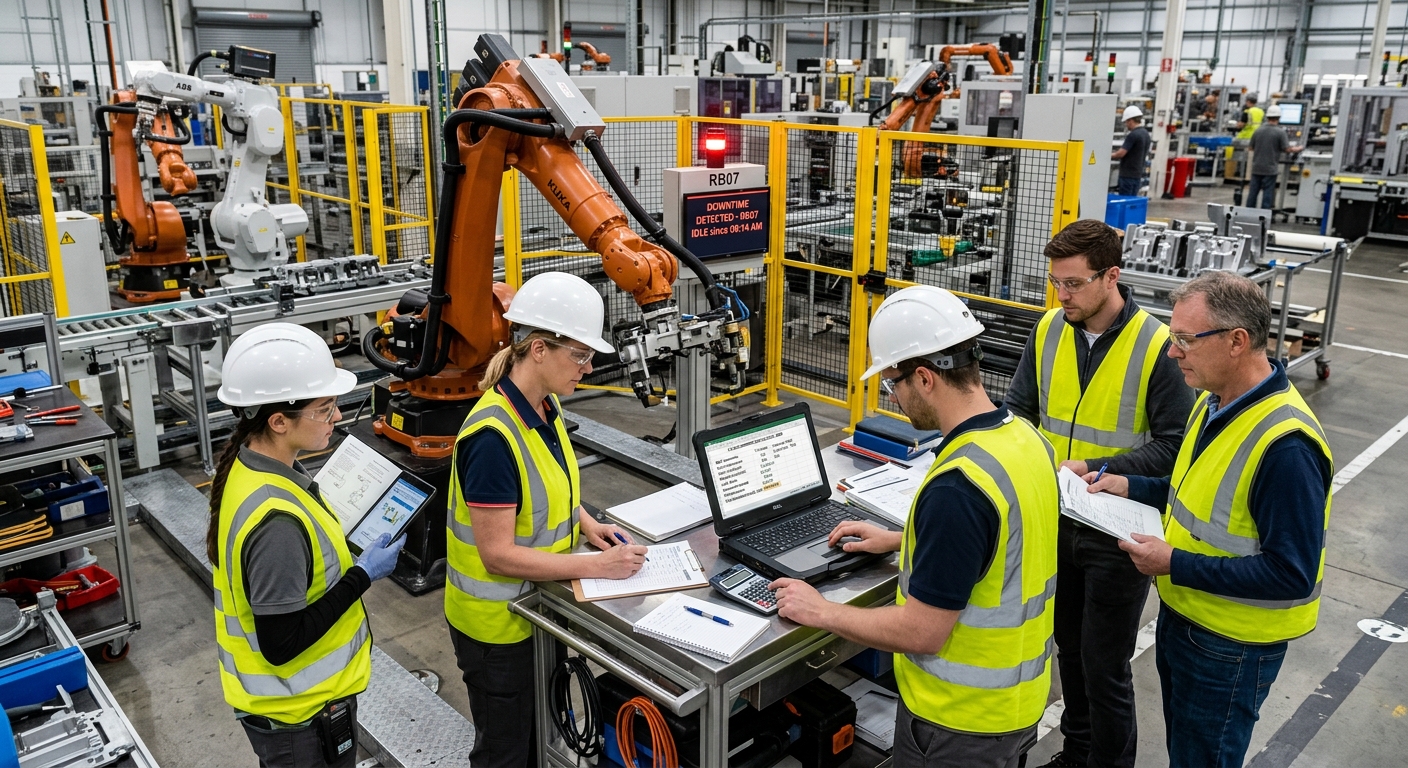
The robot stopping is only the start of the cost
A robot cell downtime cost calculation becomes misleading when a plant counts only technician time or when production is missed while the robot remains stopped. A one-hour fault can affect operators, upstream equipment, downstream operations, work in process, quality checks, maintenance resources, and the time needed to restore normal production.
For that reason, operations teams should not treat downtime as a single accounting rate. A useful calculation needs to reflect the actual production consequences of the interruption.
Start by identifying what the cell normally produces or enables per hour. Then determine which contributions disappear during the stop and add the costs created by the failure and subsequent recovery. With this information, plants can make better decisions about maintenance priorities, spare parts, technical support, training, and reliability improvements.
Start with the production value that disappears during the stop
The first question is not what the robot costs per hour. Instead, determine what production contribution disappears when the cell cannot operate.
For a standalone robotic process, the answer may be relatively easy to isolate. The situation becomes more complex when a robot feeds a machining center, serves several stations, welds assemblies for downstream operations, or palletizes the output of an entire line. In those cases, the interruption can extend well beyond the robotic cell.
A useful starting structure is
Hourly downtime cost = lost production contribution + idle labor + failure-related costs + recovery losses + consequential production losses
This framework is not a universal accounting formula. Each plant should calculate the individual components with its own production and financial data.
Lost Production Contribution
Using the full selling price of every unit not produced can substantially overstate downtime cost because revenue does not equal economic contribution. In many cases, contribution margin, throughput value, or another internally approved production measure provides a more useful basis.
Operations and finance should agree on the value before the plant starts using the downtime calculation for investment decisions. That agreement prevents maintenance teams, production managers, and finance departments from working with different definitions of the same loss.
The calculation should also consider whether the plant can recover the missing production. If operators can manufacture the lost quantity later without overtime, delayed deliveries, or displacement of other orders, the economic consequence differs from a line where every lost hour represents capacity the business cannot recover.
Production Rate Matters
Use the cell’s demonstrated production rate under normal operating conditions rather than the robot’s theoretical capability. A robot may have unused motion capacity while the complete cell remains constrained by welding time, machine processing time, fixture exchange, part presentation, inspection, pallet handling, or another process.
When production records show a consistent number of acceptable parts per hour, that actual rate provides a defensible basis for estimating the output exposed to downtime. This approach also keeps the calculation tied to complete cell performance rather than robot speed alone.
Add labor that remains committed during downtime
A stopped robotic cell does not automatically eliminate labor costs. Operators may remain near the cell while maintenance personnel troubleshoot the problem. Production supervisors, quality technicians, or engineers may also spend time supporting the recovery.
Separate labor that the plant would have paid anyway from incremental labor generated by the event. Both categories matter, but they answer different financial questions.
For example, an operator waiting during the stop represents productive capacity that the plant cannot use. By contrast, a maintenance technician called in on overtime creates an additional cash expense. Keeping these categories separate makes the final calculation more useful.
Review which people typically become involved in a robot failure, how long each function spends on the event, and whether the interruption generates overtime or external support costs. That information can reveal that the technical fault itself represents only part of the labor exposure.
Staff capability also affects downtime economics. A technically minor fault can become expensive when nobody on the shift can diagnose it, perform an authorized recovery, or recognize when the situation requires specialist support. URT’s guidance on training staff to operate and maintain industrial robots addresses this support question in more detail.
Include scrap, rework, and interrupted work in process
Not every downtime event occurs cleanly between two completed parts. A robot can stop during welding, handling, machining support, assembly, dispensing, packaging, or another operation while material remains inside the process.
Determine what happens to that work in process after the fault. Some parts can continue through production once the cell recovers. Others may need inspection, rework, reprocessing, or disposal.
Those consequences can add material cost, prior processing cost, inspection time, rework labor, and replacement production to the downtime event. A component that already passed through several manufacturing stages may carry considerably more exposure than its raw material cost suggests.
Use actual failure history when estimating this component. Do not assume that every robot stop creates scrap. If a particular fault normally causes no rejected material, adding a theoretical scrap allowance will inflate the calculation and weaken its credibility.
Quality Verification After Restart
Robot motion does not always equal restored production. Depending on the process and the type of failure, the team may need to confirm tooling position, process parameters, part condition, fixture status, program selection, or the quality of the first parts after recovery.
Include that verification period when it delays the return to normal productive output. A cell that resumes motion after 40 minutes but needs another 20 minutes before producing accepted parts creates a different economic event from a 40-minute interruption followed by immediate production.
Measure the cost beyond the robot cell
Some downtime calculations make their largest error by treating the robot as an isolated asset. In reality, a robotic cell usually connects to a larger production system, and the failure can affect equipment both before and after the cell.
An upstream process may continue temporarily by filling a buffer. Downstream equipment may also keep running until available inventory disappears. In another production layout, connected equipment may stop almost immediately because the robotic cell provides the only flow of parts.
For this reason, the cell’s position in the production flow directly influences the economic consequence of downtime.
Upstream Effects
When upstream machines continue operating during a robot failure, work in process can accumulate. Additional inventory may create handling, storage, scheduling, or restart problems even though the upstream equipment never stops.
A small or nonexistent buffer creates a different situation. Once the blocked process can no longer receive material, upstream machines may also lose productive time. At that point, the original robot fault has removed capacity from several assets.
Downstream Effects
Downstream operations can lose production when the robotic cell stops supplying components. This effect becomes especially important when high-value equipment depends on the cell or when several downstream processes share the same source.
As a result, plants should not assign the same standard hourly downtime cost to every robot. A non-bottleneck handling robot supported by substantial buffers can create a very different production impact from a robot positioned at a critical constraint.
Reliability planning therefore needs to consider the complete production system rather than the robot arm alone. URT’s guidance on minimizing downtime in robotic automation provides a broader framework for identifying those reliability risks.
Separate failure duration from recovery duration
Maintenance records sometimes measure downtime from the initial alarm until technicians clear the technical fault. That method can underestimate the actual production interruption.
A more useful measurement starts when acceptable production stops and ends when the cell returns to its normal operating condition. This distinction captures the time that matters to production rather than only the duration of the repair.
Break the event into stages to identify where the plant actually loses time:
- Production stops.
- Operators or maintenance personnel identify the fault.
- Technical support responds.
- The team diagnoses the problem.
- Maintenance personnel correct the fault.
- Authorized personnel restart the cell safely.
- The team removes or recovers interrupted work in process.
- Quality personnel verify production where required.
- Upstream and downstream flow returns to normal.
- The cell reaches its normal production rate.
Each stage can contribute to the economic loss. Measuring only repair time can hide delays caused by slow fault detection, technician availability, missing spare parts, restart procedures, or production recovery.
Spare-parts strategy becomes particularly important when a relatively inexpensive component can leave a high-value cell unavailable while purchasing sources a replacement. The right inventory decision depends on failure risk, lead time, interchangeability, storage cost, and the financial exposure created by the outage. URT’s article on spare parts for robotic maintenance examines that issue more closely.
A practical method for calculating one hour of downtime
The calculation becomes more reliable when operations, maintenance, and finance agree on the inputs. Rather than applying a generic industry number, adapt the following structure to the plant’s own costing system.
| Cost component | What to measure | Typical data source |
|---|---|---|
| Lost production contribution | Acceptable units not produced multiplied by the agreed contribution per unit | Production records and finance |
| Idle production labor | Labor capacity committed to the process but unable to produce during the stop | Shift records and labor costing |
| Incremental technical labor | Additional maintenance, engineering, integrator, or support cost generated by the event | Maintenance records and invoices |
| Scrap and rework | Material, prior processing, inspection, and rework caused by the interruption | Quality and production records |
| Recovery losses | Time and material consumed between technical restart and stable accepted production | Production and quality records |
| Upstream impact | Lost output or disruption in processes feeding the cell | Line production data |
| Downstream impact | Lost output when dependent processes run out of parts | Line production data |
| Other incremental costs | Overtime, expedited parts, external support, premium freight, or other event-specific costs | Maintenance, purchasing, and logistics records |
After measuring these components, calculate both the cost of a specific event and an estimated hourly exposure for planning purposes. Review the planning rate whenever product mix, margins, staffing, line configuration, or production constraints change materially.
Cost per downtime event provides another useful metric. Two cells may have identical hourly exposure but very different annual consequences when one suffers frequent short stops and the other experiences rare but extended failures.
Use downtime cost to decide where reliability investment is justified
Calculating downtime cost should support maintenance and investment decisions rather than simply create another number for a management report.
Compare the financial exposure with the actions that could reduce it. When one hour of lost production costs materially more than keeping a critical spare available, the inventory decision becomes easier to evaluate. If slow technical response accounts for a large part of each event, staff training or external support arrangements may deserve more attention.
Recovery data can reveal different priorities. When most lost time occurs after technicians clear the technical fault, the plant may need to improve restart procedures, quality verification, or production recovery rather than focus only on robot reliability.
The same reasoning applies to condition monitoring. Predictive maintenance creates value when available data helps the plant identify deterioration early enough to plan an intervention or avoid a costly failure. Additional sensor data alone does not justify the investment. URT’s guide to predictive maintenance, sensor data, and downtime explains that relationship.
Downtime cost can also help maintenance teams prioritize reliability work across several cells. A frequent fault on a low-impact cell may create less total exposure than an occasional failure on a bottleneck that interrupts several downstream operations.
When a single hourly downtime figure is not enough
A standard hourly number can support screening decisions, but production teams should not treat it as universally accurate. Actual cost can change substantially with operating conditions.
For example, a stop during a low-load shift may create limited economic impact when the plant has enough capacity to recover the production later. The same interruption during a constrained production period can affect delivery commitments or force the plant to use overtime. Product mix can also change the contribution associated with the missing output.
Buffers create another important variable. A short stop may have almost no immediate downstream effect when intermediate inventory absorbs the interruption. Once a longer event exhausts that buffer, however, the marginal cost can increase sharply as downstream equipment starts losing production.
Some plants therefore benefit from maintaining more than one downtime rate, such as a direct cell-level cost and a broader line-impact cost. The objective is not to make the model unnecessarily complicated. The goal is to avoid false precision when different operating conditions create genuinely different consequences.
What to measure before you trust the number
A useful downtime model needs inputs that reflect actual production behavior. Before using the result to justify maintenance spending, spare parts, training, or support decisions, confirm that the plant can capture the underlying information consistently.
- Record when acceptable production actually stops and resumes rather than relying only on maintenance ticket opening and closing times.
- Separate planned stops from unplanned downtime.
- Classify faults and causes consistently enough to identify recurring losses.
- Record scrap and rework that result directly from the interruption.
- Track technical response, diagnosis, repair, restart, and recovery time where practical.
- Identify any effect on upstream or downstream equipment.
- Use an agreed financial value for lost production instead of automatically using selling price.
- Capture incremental external support, expedited parts, overtime, or logistics costs when they occur.
- Determine whether the plant recovered the missing production later or lost it permanently.
The calculation does not need perfect data before it becomes useful. It does need enough consistency to distinguish a minor maintenance inconvenience from a failure that creates significant production exposure.
FAQ
What should be included in the cost of one hour of robot cell downtime?
Include lost production contribution, labor affected by the stop, maintenance and technical support, scrap or rework, recovery time, and any upstream or downstream production disruption. The calculation should only include costs that the event actually creates or exposes.
Should lost production be calculated using sales revenue?
Not automatically. Sales revenue and economic loss represent different measures because the plant may avoid some costs when it does not produce a unit. Operations and finance should agree on an appropriate contribution or throughput measure for the plant’s costing method.
Does downtime end when the robot starts moving again?
Not necessarily. For production costing, measure the interruption until the cell restores acceptable production. Restart checks, work-in-process recovery, quality verification, and ramp-up can extend the economic loss beyond the technical repair.
How should buffers be treated in a downtime calculation?
Buffers can delay or prevent an interruption from affecting other equipment. Calculate the actual production effect rather than assuming that every minute of robot downtime stops the entire line.
How can downtime cost help with spare-parts decisions?
The calculation gives the plant a financial basis for comparing inventory cost with production exposure. A spare that appears expensive in isolation may become easier to justify when its absence could extend a high-cost outage. Conversely, a low-risk component with a short replacement lead time may not justify local inventory.
Should every robot cell use the same downtime rate?
No. Production value, process position, available buffers, staffing, product mix, recovery options, and dependencies with other equipment all influence the impact of a stop. Cell-specific rates usually provide more useful information for maintenance prioritization.
Talk to URT about robot cell downtime
If you are evaluating robot cell downtime, contact URT. We will give you a direct, technical answer based on your actual production requirements.